Data Monitoring System
Our Clinical Health Assessment and Response Treatment (CHART) program is our user-friendly measurement-based care platform designed to help clinicians and agencies integrate progress monitoring into their everyday practice. CHART makes it easy to collect, interpret, and act on clinical data, supporting better outcomes for youth and families.
CHART is grounded in implementation science and can be customized to your workflow, measures, and population needs. Our team provides hands‑on coaching, training, and technical assistance to ensure CHART is not only implemented successfully—but becomes a meaningful, sustainable part of clinical practice.
How it works:
- CHART sends automated surveys to clients and caregivers. Surveys can also be completed in session or in the waiting room
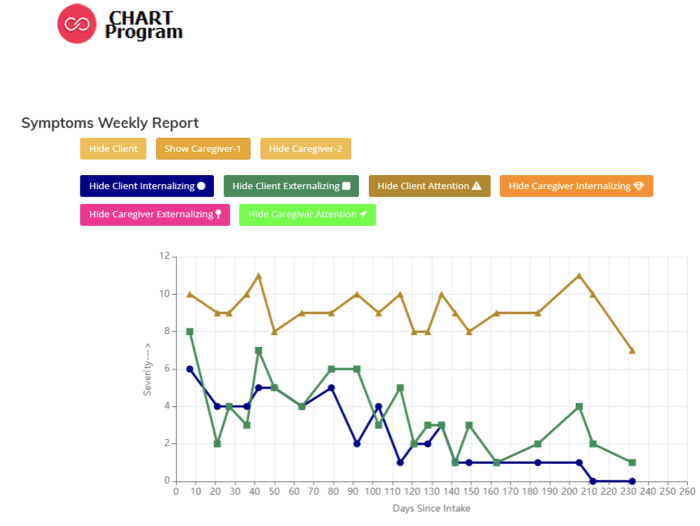
- CHART graphs client progress over time in a user-friendly dashboard that helps clinicians respond in real time to changing client needs
- Clinicians complete a brief checklist of activities each session to easily display treatment components over time
CHART allows clinicians to:
- Track client‑reported outcomes and symptoms over the course of treatment
- Review dashboards that highlight symptom change to inform treatment planning
- Use data to guide clinical decisions
- Share progress with families to collaborate more effectively
CHART allows organizations to:
- Monitor client progress at the client, clinician, and organizational level
- Review treatment activities to guide supervision
- Track program adherence and fidelity for individual clinicians and staff overall
- Aggregate client demographic and outcome data for easy reporting to payors and grants
- Identify implementation barriers
- Analyze data for ongoing quality improvement